
Dataset ER1.N3.LD • 2D
Experimental conditions- Structure: simulation of cellular organelle (endoplasmic reticulum/mitochondria) inspired structure in the field of view of 6.4 x 6.4 x 0.7 μm
- Sequence: 19'620 frames
- Modality: 2D
- Noise N3: typical photon counts and level of background for site specific dye-labelled live cell STORM sample such as ER Tracker
- Molecule density: 0.2
Reference: Sage et al., Nature Methods 2019. Open access PDF.
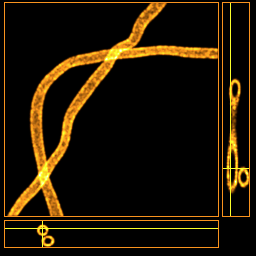
Download Dataset ER1.N3.LD
Published June 7, 2016 (DH updated October, 25 2016) as contest dataset for the challenge 2016
| Type | Modality | Link to Download | Format | Size |
| Sequence | 2D | ER1.N3.LD-2D-Exp-as-stack | ZIP, 1 TIFF stack of n images | 121 Mb |
| Sequence | 2D | ER1.N3.LD-2D-Exp-as-list | ZIP, n TIFF images | 127 Mb |
Parameters of simulation
| Camera | ||
| Photon converter factor or Quantum efficiency (QE) | 0.90 | e-/Ph. |
| Resolution | 64 | pixels |
| Pixelsize | 100.00 | nm |
| Field of view | 6400.00 | nm |
| Optics | ||
| Wavelength | 660.00 | nm |
| Numerical aperture (NA) | 1.49 | |
| Autofluorescence | ||
| Poisson Distribution | ||
| Camera Noise | ||
| Read-out: Gaussian distribution | 74.4 | |
| EMGain: Gamma | 300.0 | |
| Spurious noise: Poisson distribution | 0.0020 | |
| Analog Digital Conversion | ||
| Total gain: QE*EM_gain/e_per_ADU | 6.00 | |
| Electron conversion e- per ADU | 45.00 | e-/DN |
| Baseline | 100.00 | DN |
| Saturation | 65535.00 | DN |
| Quantization | 16-bit | |
| Computational Parameters | ||
| Thickness | 1500.00 | nm |
| Frames | 19996 | |
| Multithreading | Off-1 Thread | |
| Pixelsize to PSF convolution | 10.0 | nm |
| Pixelsize for autofluorescence | 100.0 | nm |
| Pixelsize of the camera | 100.0 | nm |
| File format | TIFF 16-bits | |